Please Sign In to contact this author.
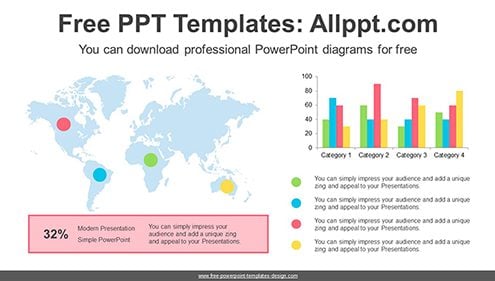
This diagram is a clustered bar graph that is represented as a world map. This clustered bar graph helps you visualize changes, comparisons, growth rates, and more. You can also…