Please Sign In to contact this author.
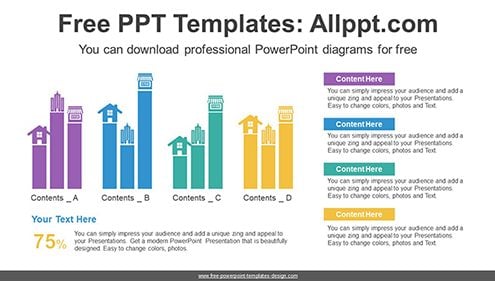
This diagram is a house-shaped grouped column chart. This is a great way to visually represent the rise and fall of real estate. Bar charts can easily adjust numeric values by entering…