Please Sign In to contact this author.
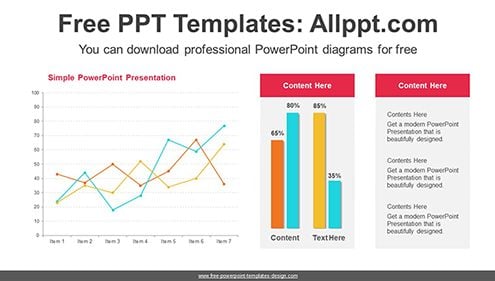
This diagram shows two charts to compare data. This makes it easy to describe the data with simple charts and text lists. Doughnut-column charts are easy to adjust numeric values…