Please Sign In to contact this author.
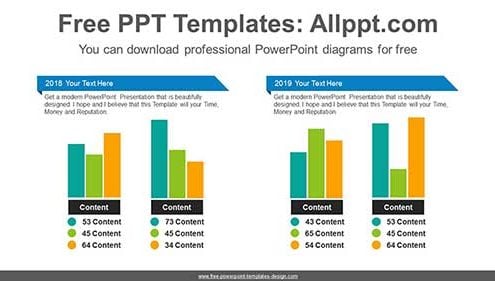
These bar charts help you visualize comparisons, such as two variations, growth rates. You can also modify data with simple formula input. Search Keywords: template, presentation,…