Please Sign In to contact this author.
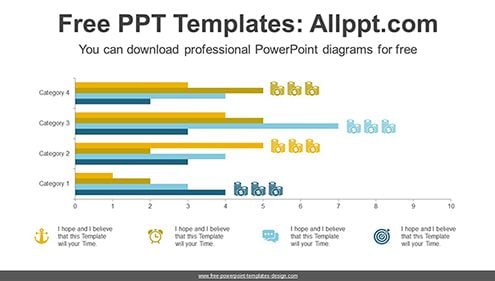
This diagram is a horizontally clustered bar graph that you can modify with simple formula input. The bar graph can be used to visualize the numerical value you want to display…